Introduction
Six months into your LLM project, someone asks: "How does our RAG pipeline actually work?" You dig through Slack. Check Notion. Find three different architecture diagrams—each contradicting the others. None match what's actually deployed.
Sound familiar? This is the documentation debt that kills AI projects. Not because teams don't document, but because traditional diagramming tools can't keep up with how fast AI systems evolve.
I've watched this play out dozens of times. A team spends hours crafting beautiful architecture diagrams in Lucidchart or draw.io. Two sprints later, they've added a semantic router, switched vector databases, and introduced a reflection loop. The diagrams? Still showing the old design, locked in someone's Google Drive. The fix isn't better discipline. It's better tools.
The Real Cost of Screenshot-Driven Documentation
When I started building production AI systems, I followed the standard playbook: design in Figma, export to PNG, paste into docs. The results were predictably bad.
Here's what actually happens with static diagrams:
They diverge immediately. You add a cross-encoder reranking stage to your RAG pipeline. The diagram still shows simple vector similarity. Nobody updates it because that requires opening another tool, finding the original file, making edits, re-exporting, and re-uploading.
They're invisible to code review. Your agent architecture changes during PR review—maybe you split one tool into two, or modified the state transition logic. The code diff shows this. Your diagram? Still wrong, and nobody notices because it's not in the diff.
They break the development flow. Good documentation happens in context. When you're deep in implementing a multi-agent workflow, the last thing you want is to switch to a visual editor, recreate your mental model, and then switch back.
I hit this wall hard while writing production-ready agentic systems. The architecture was evolving daily. Keeping diagrams synchronized was either impossible or consumed hours I needed for actual engineering.
Enter Diagram-as-Code
The solution isn't working harder at diagram maintenance. It's treating diagrams like we treat code: version-controlled, reviewable, and living alongside the implementation.
This is where Mermaid becomes essential infrastructure.
Instead of drawing boxes and arrows, you describe your system's structure in plain text. The rendering happens automatically, everywhere your documentation lives—GitHub READMEs, technical blogs, internal wikis, even Jupyter notebooks.
Here's a simple example. This code:
graph LR A[User Query] --> B[Semantic Router] B -->|factual| C[Vector DB] B -->|conversational| D[LLM Direct] C --> E[Reranker] E --> F[Context Builder] F --> G[LLM Generation] D --> G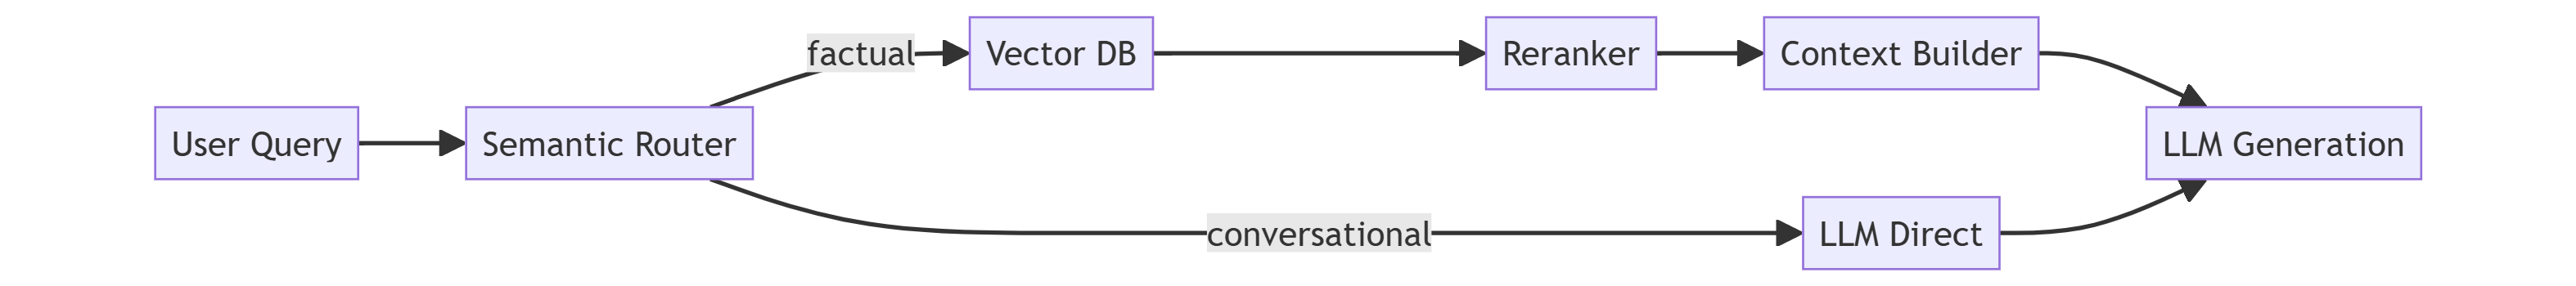
Renders as a clean flowchart showing how queries route through different paths in your RAG system. No exports, no image hosting, no version drift.
The real power emerges when this diagram lives in your repository's docs/ folder. Now when someone modifies the routing logic, they update both code and diagram in the same commit. Code review catches documentation drift before it happens.
Five Essential Mermaid Patterns for AI Engineers
Let me show you the diagram patterns I use constantly. These aren't toy examples—they're templates I've refined while building production systems that handle millions of queries.
1. LLM Agent Architecture with Tool Orchestration
Most agent tutorials show you a simple loop. Production agents are messier. They need memory systems, error handling, and complex tool orchestration.
flowchart TD Start([User Input]) --> Router{Intent Router} Router -->|search needed| ToolSelect[Tool Selection] Router -->|direct answer| Memory[Check Memory] ToolSelect --> Search[Web Search] ToolSelect --> DB[Database Query] ToolSelect --> Calc[Calculator] Search --> Validate{Result Valid?} DB --> Validate Calc --> Validate Validate -->|yes| Memory Validate -->|no| Retry{Retry Count} Retry -->|< 3| ToolSelect Retry -->|>= 3| Fallback[Fallback Response] Memory --> Context[Build Context] Fallback --> Context Context --> LLM[LLM Generation] LLM --> Update[Update Memory] Update --> End([Response])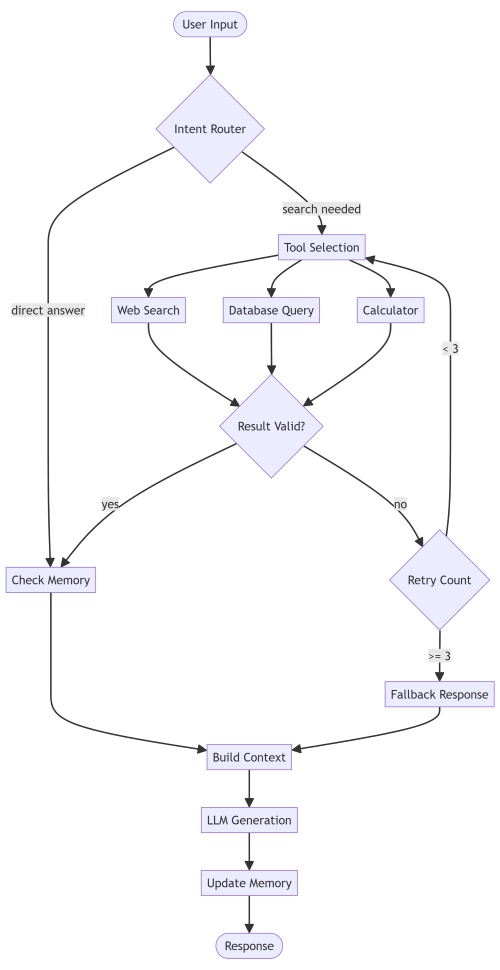
This pattern captures what actually happens: tool failures, retry logic, and memory updates. When you're debugging why your agent keeps hitting API limits, having this documented makes the problem obvious.
2. Multi-Stage RAG Pipeline
Basic RAG is "embed query, search vectors, generate response." Production RAG has stages for query rewriting, hybrid search, reranking, and context filtering.
graph TB Query[User Query] --> Rewrite[Query Rewriter] Rewrite --> Parallel{Parallel Search} Parallel --> Dense[Dense Retrieval<br/>Vector DB] Parallel --> Sparse[Sparse Retrieval<br/>BM25/Keyword] Dense --> Fusion[Reciprocal Rank Fusion] Sparse --> Fusion Fusion --> Rerank[Cross-Encoder Reranking] Rerank --> Filter[Context Window Filter] Filter --> Prompt[Prompt Construction] Prompt --> LLM[LLM Generation] LLM --> Cite[Citation Extraction] Cite --> Response[Final Response]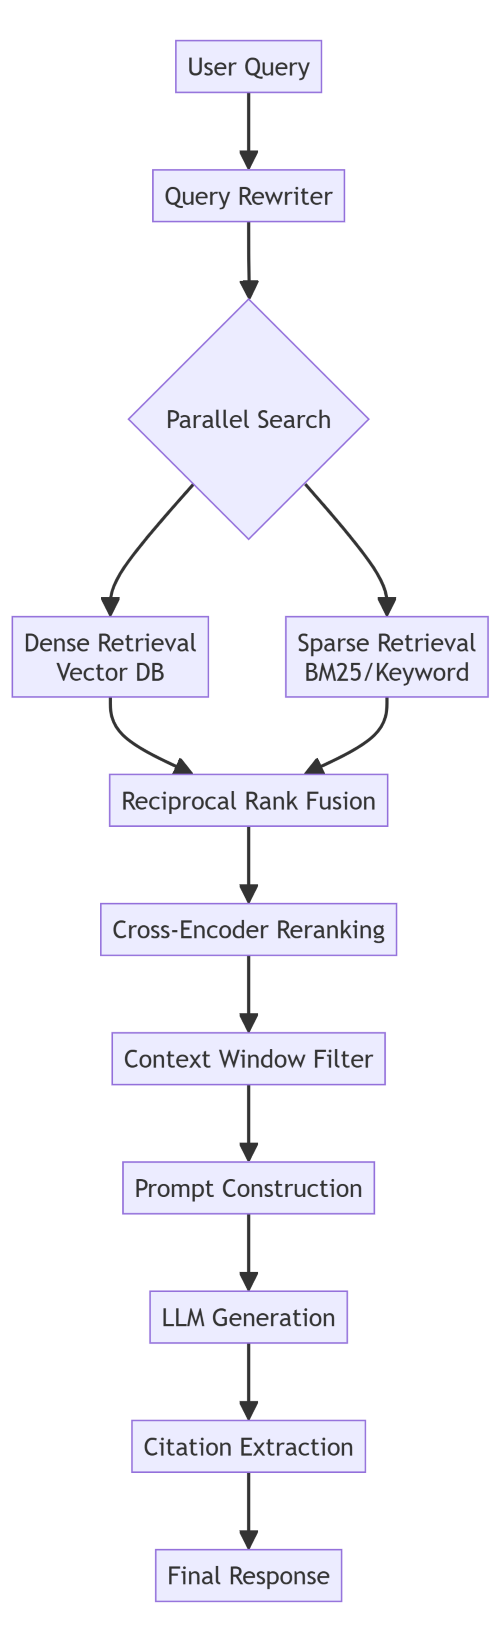
When your retrieval quality drops, this diagram tells you exactly which stage to investigate. Is the query rewriter over-generalizing? Is fusion weighting wrong? Is the reranker actually improving results?
3. Multi-Agent Research System
Research agents need more than simple tool calls. They plan, execute, reflect, and revise. This is LangGraph territory.
stateDiagram-v2 [*] --> Planning Planning --> Research: Plan Created Research --> ToolExecution: Query Generated ToolExecution --> ResultEval: Results Retrieved ResultEval --> Research: More Info Needed ResultEval --> Synthesis: Sufficient Info Synthesis --> Reflection: Draft Created Reflection --> Revision: Gaps Found Reflection --> Final: Quality Threshold Met Revision --> Research: New Questions Final --> [*]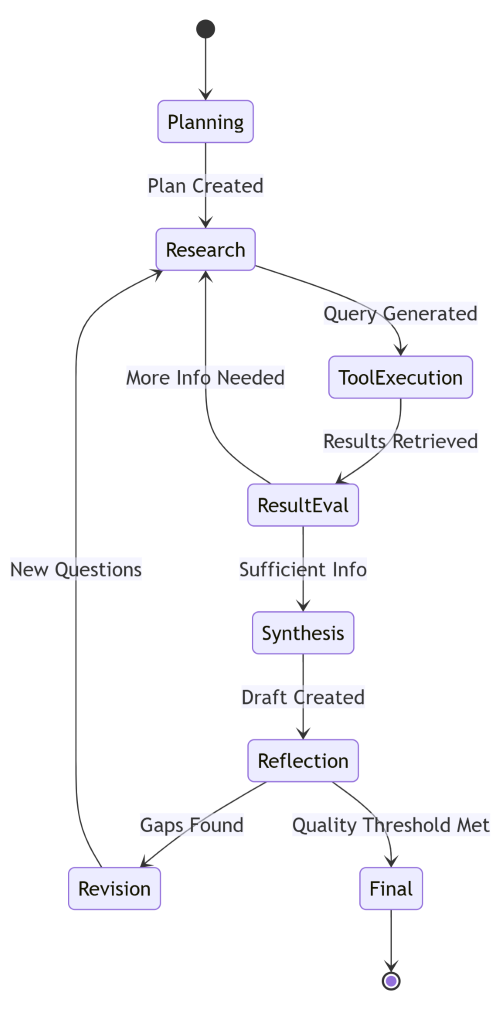
State machines are perfect for agent workflows. You can see the loops (research → tool → eval → research) and the exit conditions (quality threshold met). This maps directly to LangGraph's state management.
4. LLM Inference Pipeline with Fallbacks
Production systems need graceful degradation. When your primary model is down or rate-limited, what happens?
sequenceDiagram participant Client participant Gateway participant Primary as GPT-4 participant Secondary as Claude participant Fallback as Local Model participant Cache Client->>Gateway: Request Gateway->>Cache: Check Cache alt Cache Hit Cache-->>Gateway: Cached Response Gateway-->>Client: Response (5ms) else Cache Miss Gateway->>Primary: Generate alt Primary Success Primary-->>Gateway: Response Gateway->>Cache: Store Gateway-->>Client: Response (800ms) else Primary Error Gateway->>Secondary: Fallback Request alt Secondary Success Secondary-->>Gateway: Response Gateway-->>Client: Response (1200ms) else All Failed Gateway->>Fallback: Local Generation Fallback-->>Gateway: Degraded Response Gateway-->>Client: Response (400ms) end end end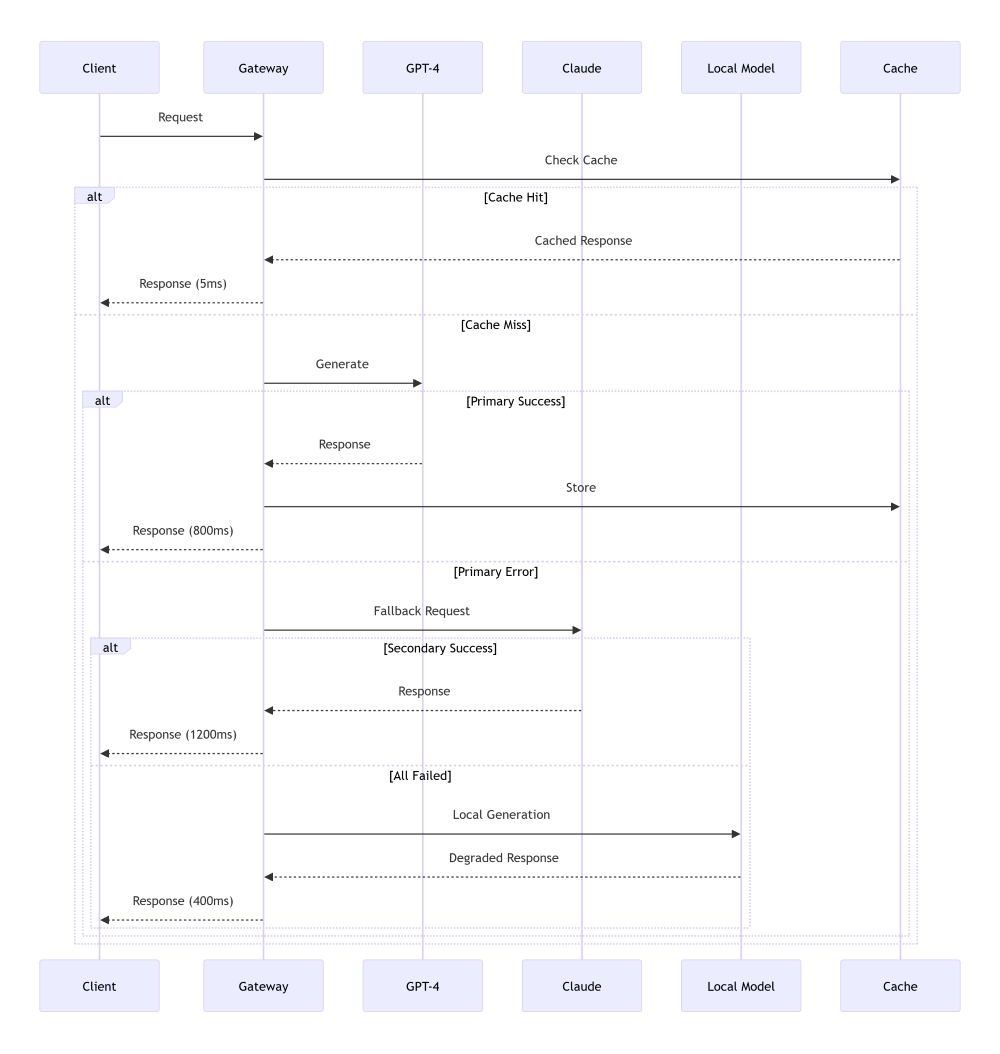
Sequence diagrams excel at showing timing, fallback chains, and interaction patterns. This one shows exactly how your system degrades under load—critical for reliability planning.
5. Agent State Transitions with Error Handling
Real agents don't just flow forward. They handle errors, timeouts, and invalid states.
stateDiagram-v2 [*] --> Idle Idle --> Processing: New Task Processing --> ToolCall: Action Required ToolCall --> Success: Result OK ToolCall --> Timeout: No Response ToolCall --> Error: API Error Timeout --> Retry: Attempt < 3 Error --> Retry: Retriable Error Error --> Failed: Fatal Error Retry --> ToolCall: Backoff Complete Success --> Processing: Continue Processing --> Complete: Task Done Complete --> Idle: Reset Failed --> Idle: Manual Reset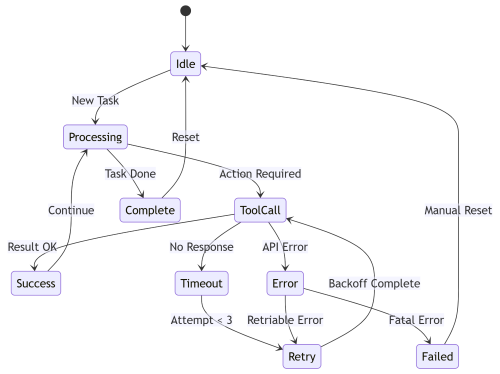
This is the diagram I wish I'd had when debugging why agents were getting stuck. You can trace any execution path and see exactly where state transitions should happen.
Making Mermaid Work in Your Stack
The diagrams are useful, but only if they integrate seamlessly into your workflow. Here's how I've set this up across different contexts.
GitHub Integration
Mermaid renders natively in GitHub. Drop the code in any .md file. Your README, PR descriptions, and documentation all render diagrams automatically. No image hosting, no broken links.
When you're proposing architecture changes, include a Mermaid diagram showing the new flow. Reviewers see the change visually before diving into code.
Documentation Sites
I use Quarto for technical writing, but the pattern works for MkDocs, Docusaurus, and most static site generators.
For Quarto:
format: html: mermaid: theme: neutralThen diagrams just work in your .qmd files. The theme setting keeps them readable in both light and dark modes.
Jupyter Notebooks
When prototyping AI systems, I document the architecture right in the notebook:
from IPython.display import display, Markdown<div></div>mermaid_code = """```mermaidgraph TD A[Data] --> B[Preprocess] B --> C[Embed] C --> D[Index]display(Markdown(mermaid_code))This keeps exploration and documentation together. When the experiment becomes production code, the diagram moves with it.
VS Code
The Mermaid Preview extension lets you see diagrams as you write them. Edit your architecture doc, see the diagram update live. This tight feedback loop makes documentation actually enjoyable.
Advanced Patterns I've Found Useful
Once you're comfortable with basic diagrams, these techniques will level up your documentation game.
Custom Styling for Component Types
Different components deserve different visual treatment:
graph LR A[User Input]:::input --> B[LLM]:::model B --> C[(Vector DB)]:::storage C --> D[Results]:::output classDef input fill:#e1f5ff,stroke:#01579b classDef model fill:#fff9c4,stroke:#f57f17 classDef storage fill:#f3e5f5,stroke:#4a148c classDef output fill:#e8f5e9,stroke:#1b5e20
Color coding makes complex diagrams scannable. Blue for inputs, yellow for models, purple for storage, green for outputs. Your brain pattern-matches instantly.
Subgraphs for System Boundaries
When documenting microservices or multi-container deployments:
graph TB subgraph "API Layer" A[FastAPI] --> B[Auth Middleware] end subgraph "Processing Layer" C[Agent Orchestrator] D[Tool Manager] E[Memory Store] end subgraph "Infrastructure" F[(PostgreSQL)] G[(Redis)] H[Vector DB] end B --> C C --> D C --> E E --> F D --> G C --> H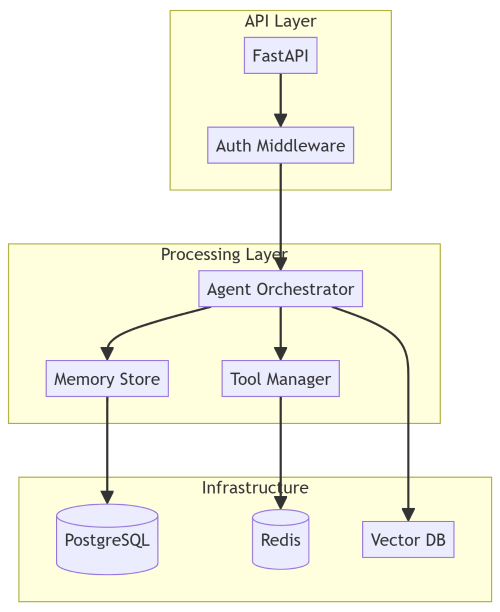
Subgraphs make system boundaries explicit. You can see what's stateful versus stateless, what scales horizontally, where your bottlenecks are.
Links to Code
This is borderline magical. You can make diagram nodes clickable:
graph LR A[Agent Router] --> B[Search Tool] click A "https://github.com/yourorg/repo/blob/main/agent/router.py" click B "https://github.com/yourorg/repo/blob/main/tools/search.py"
Your architecture diagram becomes a navigable map of your codebase. Click a component, jump to its implementation.
When Mermaid Isn't Enough
I'm bullish on diagram-as-code, but it's not universal. Know the limits.
Complex visual design. If you're creating marketing materials or presentation slides with custom branding, use proper design tools. Mermaid is for technical documentation, not visual design.
Extremely large graphs. Once you hit 50+ nodes, Mermaid diagrams become hard to read. At that scale, consider breaking into multiple diagrams or using specialized graph visualization tools.
Real-time monitoring. Mermaid is static. If you need live system visualization—metrics flowing through your pipeline, real-time dependency graphs—you want something like Grafana or custom dashboards.
The sweet spot is architectural documentation, system design, and workflow explanation. That covers 90% of what AI engineers need to document.
Making This Stick
Here's how I've built this into my development workflow so it actually happens:
Diagram-first design. When planning a new feature, I sketch it in Mermaid before writing code. The act of documenting the design forces me to think through edge cases and dependencies.
PR templates with diagram prompts. Our PR template asks: "Does this change affect system architecture? If yes, update or add Mermaid diagrams." Makes documentation part of the review process.
Living architecture docs. We maintain a docs/architecture/ folder with Mermaid diagrams for each major subsystem. When the system changes, the diff shows both code and diagram updates.
Blog post diagrams as code. When I write technical posts, diagrams are Mermaid by default. This means I can update them easily, and readers can fork the code to customize for their needs.
The Bigger Picture
This isn't really about Mermaid. It's about treating documentation as code.
When I look at successful AI engineering teams, they share a pattern: their documentation lives close to the implementation. Design docs in the repo. Architecture diagrams version-controlled. API specs generated from code.
The teams struggling with documentation debt? Their diagrams live in Google Slides. Their architecture docs are in Confluence, last updated six months ago. There's friction between writing code and updating docs, so docs don't get updated.
Mermaid removes that friction. Your diagram is a text file in your repo. Updating it is as natural as updating a comment. Code review catches documentation drift. Your architecture is always in sync because the alternative is harder.
For AI systems—where complexity grows fast, and architectures evolve constantly—this matters more than most domains. The difference between a team that can onboard new engineers in days versus weeks often comes down to documentation quality.
And documentation quality comes down to whether updating it is painful or painless.
Getting Started Today
If you're convinced but not sure where to start:
Pick one system to document. Don't boil the ocean. Choose one complex workflow—maybe your RAG pipeline or agent orchestration logic—and diagram it in Mermaid.
Put it in your repo. Create a docs/architecture.md file. Diagram goes there. Commit it.
Link from your README. Make the documentation discoverable. "See architecture docs for system design."
Update it in your next PR. When you modify that system, update the diagram in the same commit. Feel how much easier this is than updating a PowerPoint.
Expand gradually. As you see the value, add more diagrams. Sequence diagrams for complex interactions. State machines for agent workflows. Flowcharts for decision logic.
The goal isn't comprehensive documentation on day one. It's building a habit where documentation updates are as natural as code updates.
Resources and Templates
I've already provided production-ready Mermaid templates for common AI system patterns above. You can customize it for your needs.
Useful Mermaid resources:
-
Official documentation - comprehensive reference
-
Live editor - test diagrams instantly (I created this for FREE usage - No data storage, runs on your browser locally)
-
VS Code extension - preview while editing
-
GitHub support docs - integration details
The documentation is surprisingly good. When you need specific syntax, the live editor's auto-complete helps.
Final Thoughts
Your AI system is going to change. New techniques will emerge. Your architecture will evolve. That's the nature of working in a fast-moving field.
The question is whether your documentation will keep up.
Static diagrams won't. Screenshot-driven workflows can't. The friction is too high.
Diagram-as-code can. When updating documentation is as easy as updating code, it actually happens.
I've seen this transform how teams work. Less time in meetings explaining architecture. Faster onboarding. Fewer "wait, how does this actually work?" moments.
The switch isn't hard. Pick one diagram you currently maintain in a visual tool. Recreate it in Mermaid. Put it in your repo. Update it once. You'll feel the difference.
That's when you'll know this isn't just another documentation fad. It's the infrastructure for how modern AI systems should be documented.
Related Articles
- Agent Building Blocks: Build Production-Ready AI Agents with LangChain | Complete Developer Guide
- LLM-Powered Chatbots: A Practical Guide to User Input Classification and Intent Handling
- Building Agents That Remember: State Management in Multi-Agent AI Systems
- Building Production-Ready Agentic AI: The Infrastructure Nobody Talks About
Follow for more technical deep dives on AI/ML systems, production engineering, and building real-world applications: